TECHNICAL ANALYSIS FOR CS2 SKINS

See beyond
the price.

Advanced charting.
A clearer view of the skin market.

SkinTix brings technical analysis to CS2 skins. Read price history and trading activity, work with indicators, and draw your own levels. Set alerts and save your analysis so you can return to the market with a plan.

CHARTSINDICATORSALERTSYOUR ANALYSIS
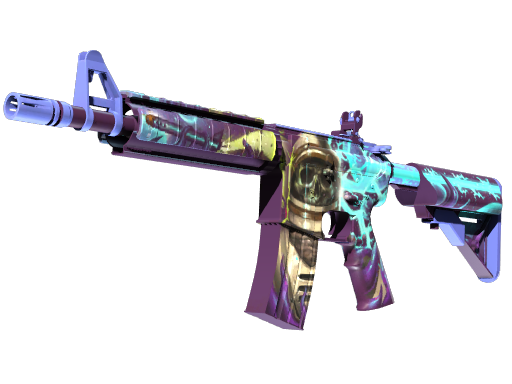
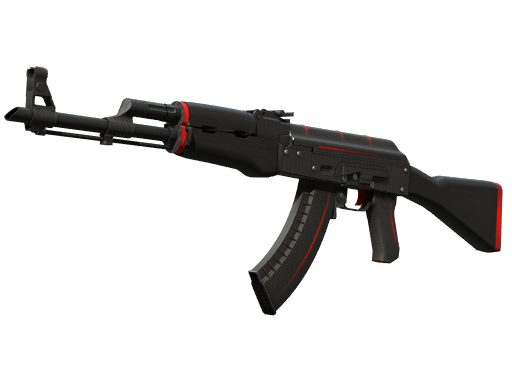
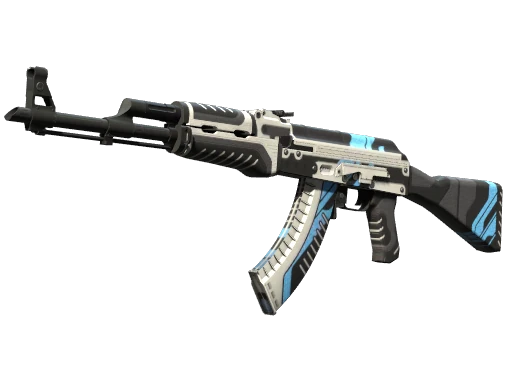
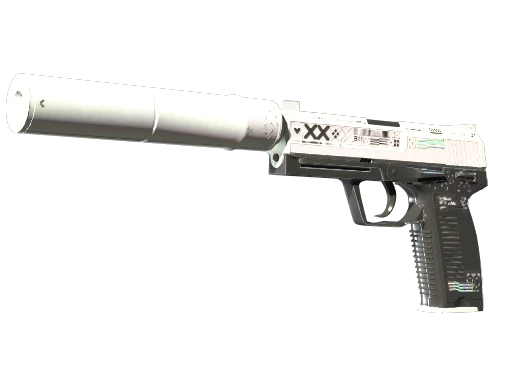
THE SKINS. THE SIGNALS.

Iconic skins.
Different stories.

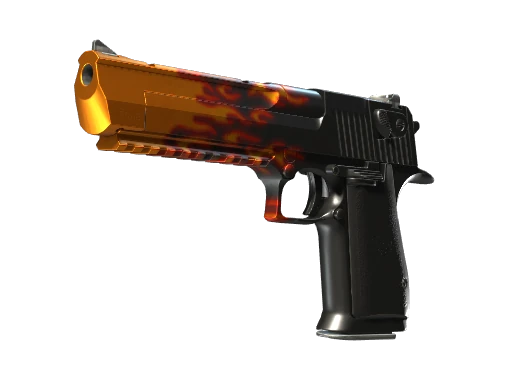
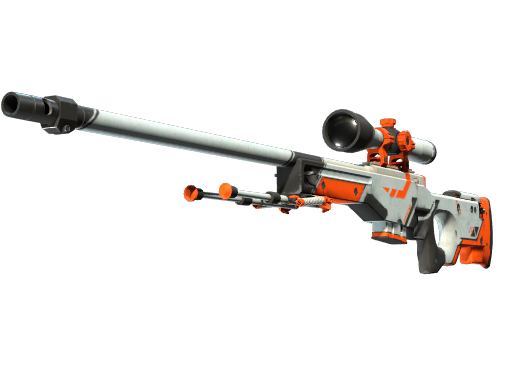
Actual CSFloat daily averages.
1-month change · completed UTC days.
Snapshot: 13 Oct 2026.
SKINTIX / ANALYSIS TERMINAL● BETA
01 / TECHNICAL ANALYSISACTUAL SKINTIX INTERFACE ↗
01 / BUILT FOR YOUR ANALYSIS

The market moves.
Build your own perspective.

For skin traders, collectors and players who want more context before their next move.

A technical analysis workspaceChart prices, study indicators, mark levels and save your research.

CS2 skins and exact variantsResearch weapons, knives, gloves and other catalogue items with available history.

Transparent market dataCSFloat daily sale averages and sales counts, separate from marketplace listing prices.

01 — ANALYSE

From price
to perspective.

Explore daily average sale prices and recorded sales volume. Change time ranges, add RSI, MACD, Bollinger Bands or Stoch RSI, and compare the latest move with the skin’s history.

Price historySales volumeTechnical indicators

Put it to work → Check whether a price move comes with a change in trading activity.

Explore the charts ↗
02 — DISCOVER

Find a signal.
Investigate the move.

Use Trends to scan price changes, trading activity and RSI signals. Pick a timeframe and category, explore the full results, then open the chart to check the context.

Price moversTrading activityMarket filters

Put it to work → Find items to research without opening every chart one by one.

Open Trends ↗
03 — GET SPECIFIC

The right skin.
The exact variant.

Search the CS2 catalogue by weapon, rarity, wear and edition. Check item details, available Skinport and Steam quotes, or follow a link to a marketplace.

WearStatTrak / SouvenirCollections
Price history is available for part of the catalogue. Marketplace listings and average sale prices are separate data.
04 — KEEP YOUR PLAN

Your charts.
Your conclusions.

Mark levels, draw trend lines and channels, and use Fibonacci or the ruler. Add notes and save your work to your account so you can return to the analysis after signing in.

AutosaveNotesJSON export
Favourites and local saves stay on your device. An account stores your chart analyses.
02 / THE SKINTIX TOOLKIT

Advanced tools.
One focused workspace.

Start analysing ↗
01 / TECHNICAL ANALYSIS

Make the chart
your own.

Work with RSI, MACD, Bollinger Bands and Stoch RSI. Draw levels, trend lines, channels and Fibonacci. Measure moves and add notes to your setup.

IndicatorsDrawing toolsRuler
Indicators use available average sale prices. Missing history remains visible.Open charting ↗
ILLUSTRATIVE ALERT SETUP
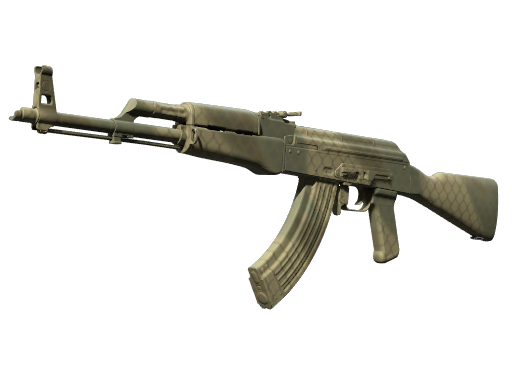
AK-47 | VulcanACTIVE
ConditionCrosses above
ThresholdSaved chart line
02 / PRICE ALERTS

Set the condition.
Keep your focus.

Create an alert from a price level or saved line. Choose above, below or a crossing condition. Manage your alerts in one list and reopen the related chart.

Price conditionsSaved linesEmail alerts
Checks use completed daily UTC averages. Account alerts support background checks and verified email notifications; guest alerts run while the app is open.Explore alerts ↗
03 / TRENDS

A wider view.
A shorter shortlist.

Scan price movers, sales activity and RSI signals. Switch periods and categories, explore full lists, and move from a signal to the item’s chart.

Price changesActivityRSI signals
Results depend on available history and use completed UTC days.Scan the market ↗
03 / FROM THE SKINTIX SCANNER

Market moves.
Ready to investigate.

View all Trends ↗

Five notable price moves among items with recorded sales and sufficient history. Open any item to explore its chart.

Scanner snapshot · 14 Oct 2026, 14:53 UTC
ITEM / VARIANTDAILY AVERAGECHANGESALES IN PERIOD

CSFloat daily average sale prices in USD. Not the lowest listing or an intraday quote. Stickers, float premiums and low sales counts can affect averages. These are research leads, not recommendations.

04 / FROM SKIN TO SETUP

Three steps.
Your own analysis.

01

Find your item

Search the catalogue or start with Trends. Choose the exact wear and edition you want to study.

02

Build your view

Explore the available history, sales volume and indicators. Mark the levels that matter to your analysis.

03

Save your setup

Add notes, set an alert and save your analysis. Come back when there is a new move to review.

05 / GOOD TO KNOW

Clear answers.
Better context.

What is SkinTix?+

SkinTix is a technical analysis platform for CS2 skins. It brings price charts, indicators, drawing tools, alerts and a market scanner into one workspace. You build your own analysis; purchases happen on external marketplaces.

Is it useful if I am new to technical analysis?+

You can start with price history, sales activity and simple notes. When you want more detail, add indicators, draw levels and set conditions for alerts. SkinTix gives you the tools to investigate; it does not tell you what to buy.

Do I need an account?+

You can explore charts and save work locally without an account. An account lets you save analyses, return to them after signing in, and use background alert checks. Email alerts require a verified notification address.

Where do the prices come from?+

Charts use CSFloat daily average sale prices in USD. Volume is the recorded number of sales. The current UTC day can be incomplete and is marked provisional. Skinport listing quotes and Steam wallet prices are shown separately.

Does every skin have price history?+

No. The catalogue is larger than the available price coverage. History is added gradually. Missing dates and unavailable series remain visible rather than being filled with invented values.

What does beta mean?+

SkinTix is an evolving MVP. Available history and quotes depend on the data sources. Email/password sign-in does not yet include password recovery or verification of the sign-in address. Verification for alert email notifications is a separate feature.

Read the SkinTix product and data guide ↗ for a clear explanation of features, data sources and limitations.

YOUR MARKET. YOUR PERSPECTIVE.

Your next move?
Start with the chart.

Choose a skin. Explore the data. Build your own analysis.

Start analysing ↗Sign in to your workspace →
LET’S TALK / CONTACT

What can we
make better?

Have a question, an idea or feedback about SkinTix? Send us a message. We will get back to you as soon as we can.

We use your details to handle this message and reply. Your message is sent to the SkinTix team.

Enlarged SkinTix interface screenshot